
Every report can also be shown as a graph or chart. But they show up in the dashboard section, not the reports section.
If you create a new dashboard, you can click on "Add Dashlets to Dashboard".
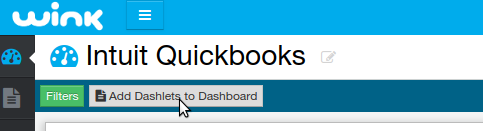
This will bring up a list of all your reports. Simply add the reports you want as per this video:
If you've created and edited your own reports, you can configure the chart type and settings by going to the "Dashlet" section in the designer:

Once you've saved the report, the new dashlets will update in your dashboards.